Informatics
The mission of the Informatics team is to help people within the Facilities Management organization to access, view and understand the vast data we collect and to enable data-informed decisions that improve the business value Facilities Management delivers.
The Informatics team creates data visualizations and reports that answer questions posed by members of our organization and to explore questions about Facilities Management's operations.
Our work increases efficiency by replacing old applications or manual processes used in the past to gather information. Investigating building costs is now a process performed easily using data visualization tools, such as Tableau, with greater flexibility. In the past, this was a complex process that required the team to perform queries in AiM, export and manipulate the data in a spreadsheet and then draw conclusions.
By increasing awareness of our informatics capabilities and promoting participation in data analytics, we hope to provide people with tools to make their jobs easier and increase efficiency.
Tableau Server
Logging in
Only FM employees granted access can connect to Tableau Server (through NetBadge). If you don't have access, please submit a request through SysAid.
Development*
*Only used by Tableau Desktop software creators
Tableau Server is an online environment where users can explore, interact with and consume Facilities Management data. Data visualizations created by the Informatics team live in Tableau Server. The department maintains two Tableau Server sites: Production (Prod) and Development (Dev).
| Production (Prod) | Development (Dev) |
|---|---|
|
|
Navigating
Navigate to a project that interests you. Within each project, there are workbooks that contain views of the data.
Download complete Tableau Server Basics
- Click on a project folder - this takes you to the workbooks inside the folder
- Click on a workbook - this takes you to the views inside the workbook
- Click on a view
- This is a view. Views can have graphs, tables, and filters.
Interacting with workbooks
- Actions are ways for the user to interact with the data. For example, clicking on a building on a map may filter a list of work orders to just that building's work orders.
- The information icon contains an overview of the workbook and information about actions. It is found in the top left corner of the first view of a workbook.
- Filters generally default to some preselected values (to improve load speed). Be sure to review the filter selections when looking at a view to ensure you are getting the desired information.
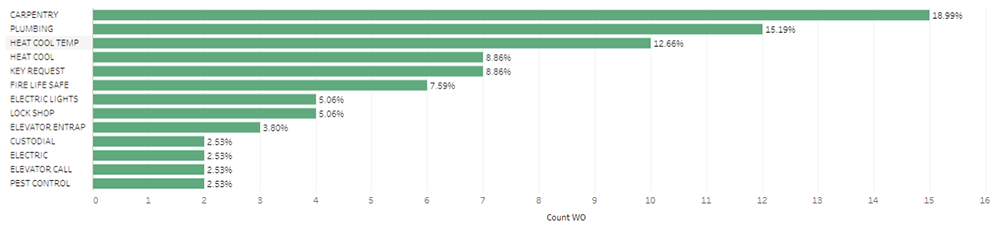
- Informational views answer specific questions.
For example, What is the most frequent problem code associated with my building?
- Interactive views require user interaction and encourage data exploration.
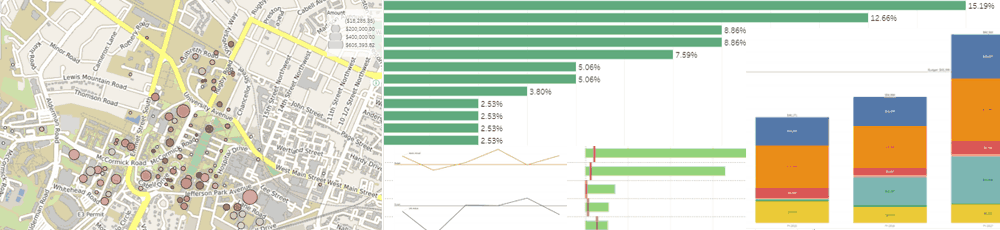
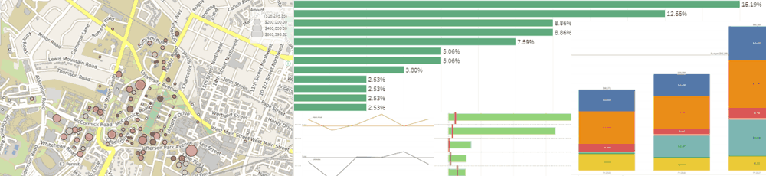
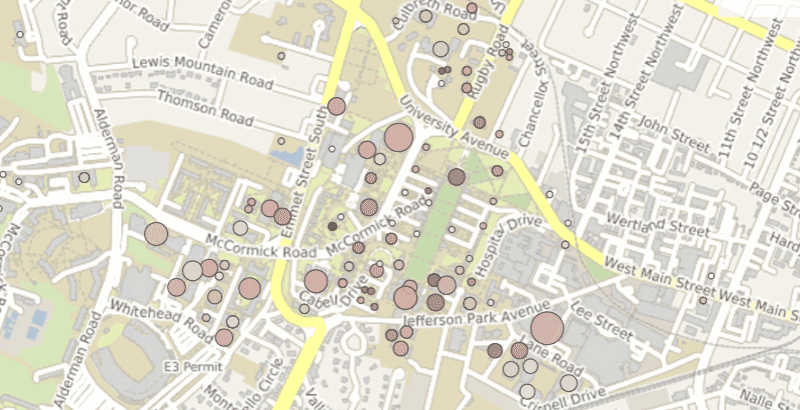
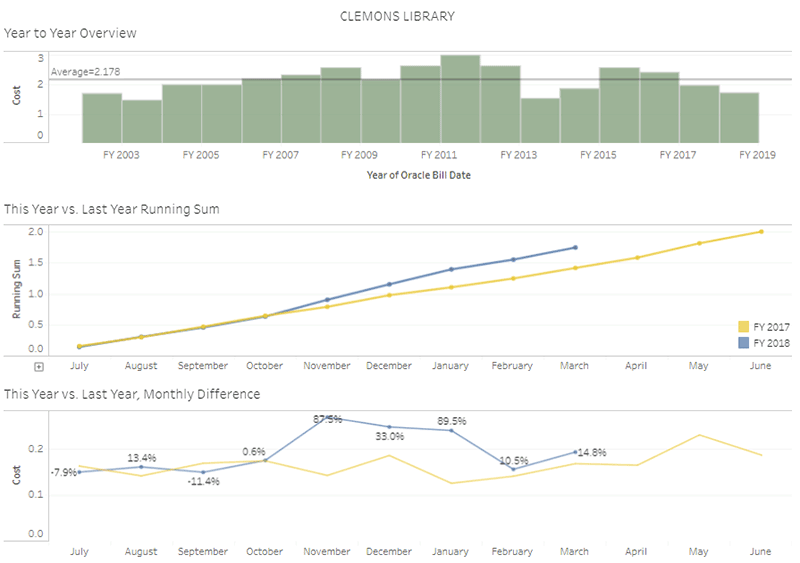
For example, the following workbook allows the user to select a building from the map and view monthly cost trends in that building. Looking into the resulting graphs may pose additional questions, like why are the costs in 2018 exceeding 2017 costs? The answer to that could be found by diving into another workbook that addresses work orders in more detail.
Where do I start?
Here is a sample list of production workbooks that can answer the following specific questions:
- How are we performing against MOU budgets in Stone Hall?
Stone Hall Expense Tracking - Are we completing PM on time?
Maintenance Work Analysis - How are my buildings' utility consumption and costs trending?
Utility Building Costs - Have my employees submitted 40 hours of time this week?
AiM Time Entry - Are my apprentices meeting the requirements for different training areas?
Apprentice Training Area - What is the work to leave ratio in my org/shop this year?
Workday Labor Activity
Training
General use training
The following trainings provide an introduction to navigating and interacting with Tableau Server.